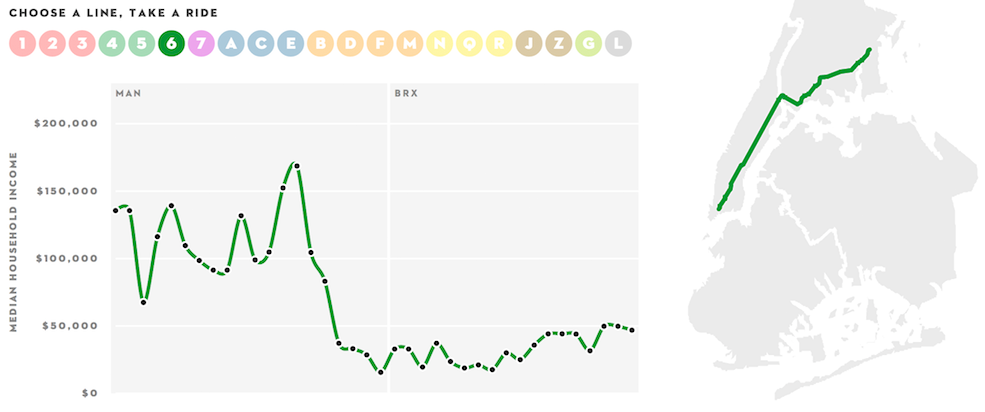
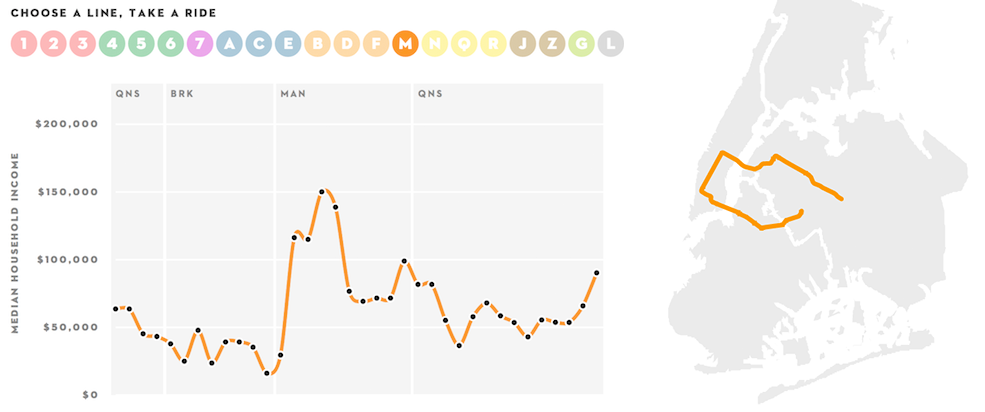
The New Yorker released this week an interactive infographic in the likes of The New York Times’ which charts how income in New York shifts, from poverty to considerable wealth, along MTA’s subway lines using data from the U.S. Census Bureau.

Quoting New Yorker,
[…] if the borough of Manhattan were a country, the income gap between the richest twenty per cent and the poorest twenty per cent would be on par with countries like Sierra Leone, Namibia, and Lesotho.
Aside the public debate this story spurs, which is of interest and importance—to talk about our cities’ problems and issues like gentrification, urban planning and microeconomics, as well as the actual social and economic policy debate (eg. how to create growth), it also signifies the importance and potential of data journalism in our times.

Even The New Yorker, an old, prestigious magazine mainly about politics, social issues, art, and culture has started experimenting with data journalism. Their stories might not be “New York Times” yet, but it broadcasts a clear message: data journalism is here to stay and—more importantly—disrupt the journalism industry, and push it into a new domain where journalists collaborate with mathematicians, statisticians, and programmers to analyze and interpret the world and the facts.
While data alone is uninteresting as it is simply numbers (no one likes digit-filled spreadsheets and databases if they can’t be of use) the magic is in what the numbers represent; the relationships, context, patterns and stories in and of our world that are important to us and our lives. Data journalism is basically when number-crunching meets storytelling. And now that information is abundant around us, the procedure to collect it, categorize, rank, understand and process it is more important than ever.
In this context, crowdsourcing is very relevant too. The news about the recent bombing of Boston Marathon quickly broke on the Internet first—before even hitting TV—with photos, videos, texts, and more. Twitter proved to be the go-to tool for obtaining up-to-the-second news. Sharing information throughout its network takes always (on events like these) a huge viral effect. Also Reddit took time to organize and help with everything, and even make attempts to find the actual bombers with “image forensics” and a Google Docs spreadsheet.
Data will be is a force that can drive innovation, quality, objectiveness, and, overall, can revolutionize not only journalism but other aspects of our lives like health, fitness, and pretty much everything else, too.
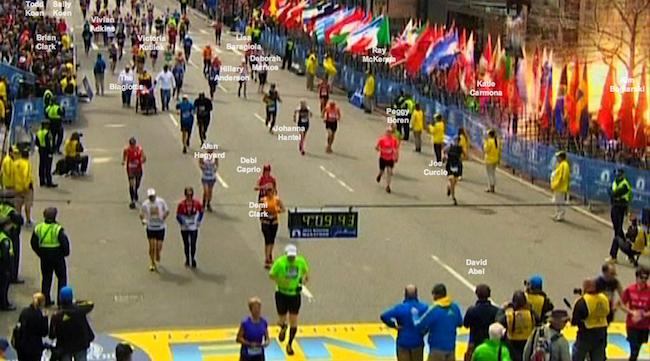
Upd: Phenomenal storytelling by The New York Times. In “4:09:43” The New York Times speaks to 19 people near the finish line at the moment the bomb exploded in Boston.
